
The Mediarails Dashboard makes it simple to monitor your team's recruiting productivity and your partners' performance at a glance.

The dashboard allows you to check stats on various aspects of your program, including recruitment activities and overall partner performance.
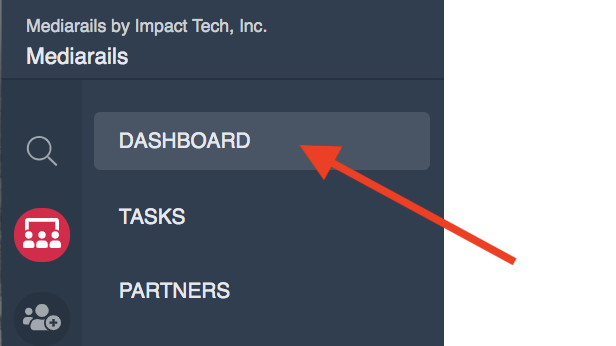
The Home Dashboard is the default page that appears upon login. To navigate to the dashboard at any time, simply click the Dashboard button in the left sidebar like shown below:
Dashboards
There are three tabs across the top of the main dashboard page that enable you to view insights on various aspects of your program. Scroll down for more info on each dashboard.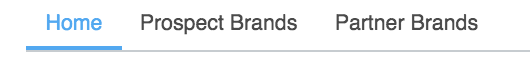
Set the Time Frame & Filters
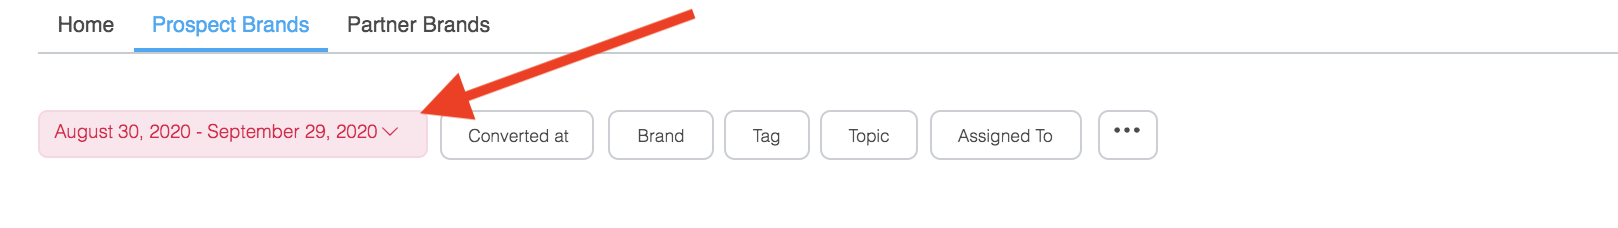
Each dashboard has a time frame that can be set. By default, all dashboards are set to the last month (30 days). To change the time frame, click on the red box for time frame and select a new option.
Please note that on the Home Dashboard the time frame selector is in the middle of the page.
Filters
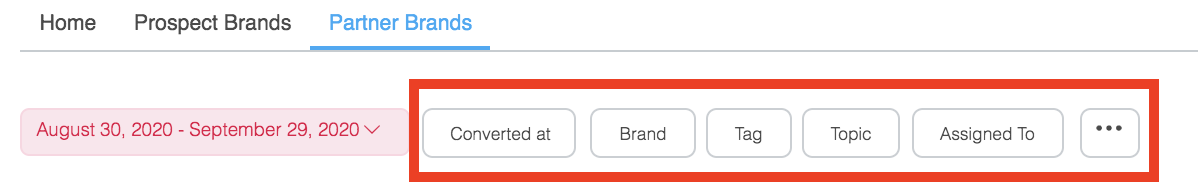
There are various filtering options available on the Prospect and Partner Brands Dashboards.
Filters allow you to see metrics for specific brands, tags, topics, and more. Filters make it easy to check on metrics for only one brand, or only one tag (such as a recruiting tag used in Email Workflows). Select the three dot icon for more filtering options.
Home Dashboard
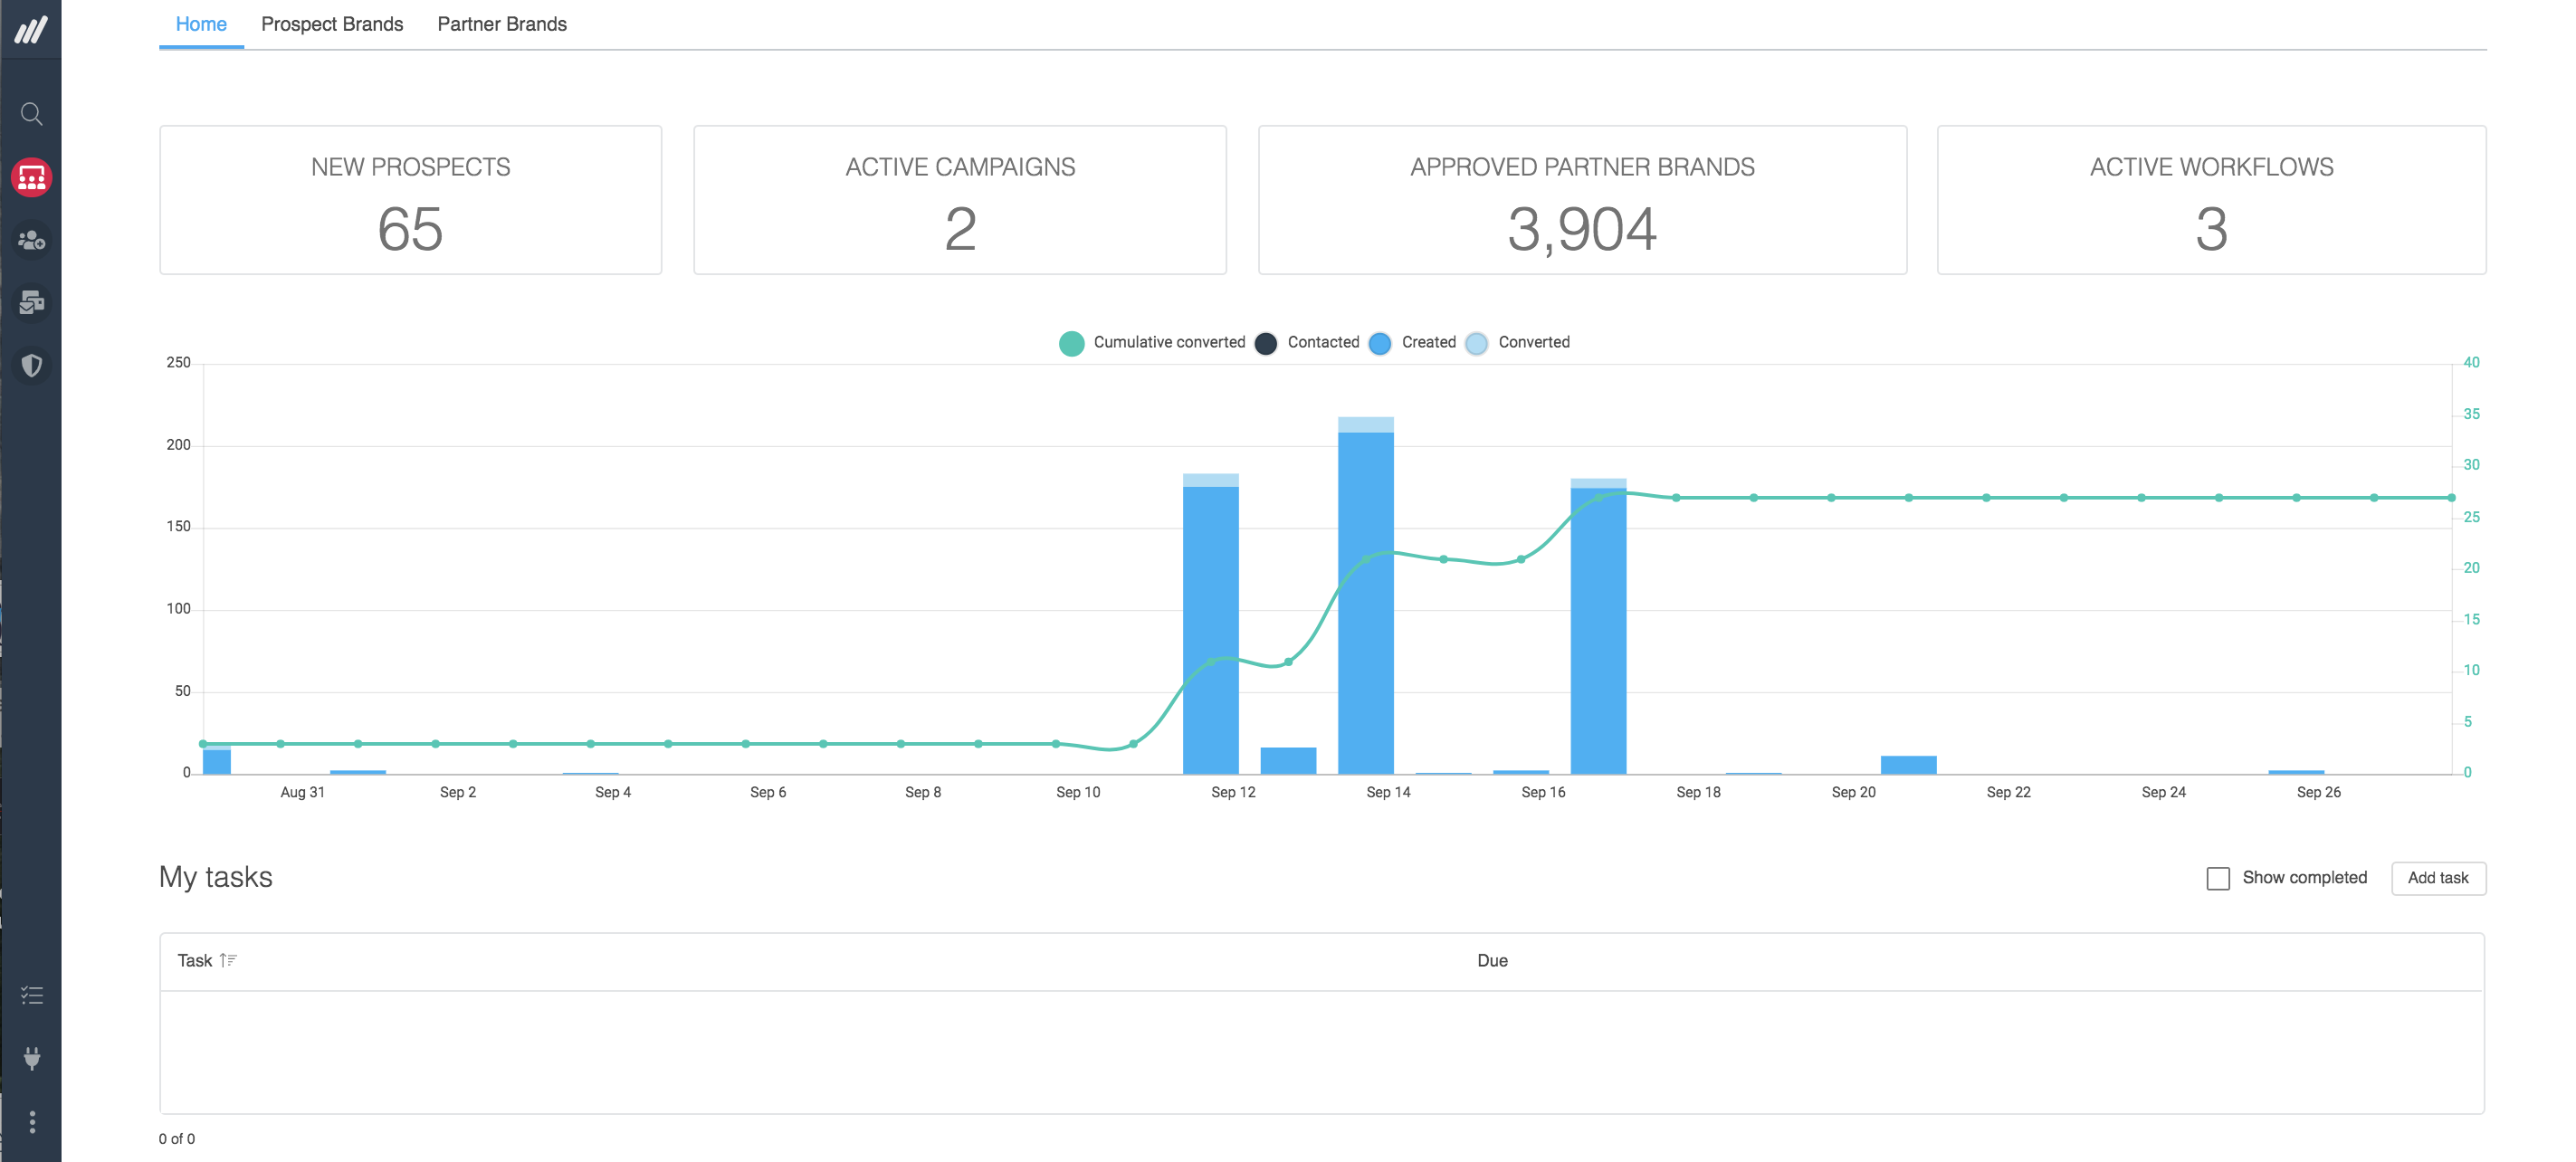
Home is the default dashboard, it shows metrics on both the Prospects and Partners workspaces. In the Home dashboard, you are able to view the following (listed from left-to-right & top-to-bottom of page):
- Number of new Prospects
- Number of currently active Campaigns
- Number of approved partners
- Number of active Email Workflows
- A chart showing the number of Prospects created, contacted, and converted
- Tasks assigned to you
- Prospecting & email activities completed by each user
Prospect Brands Dashboard
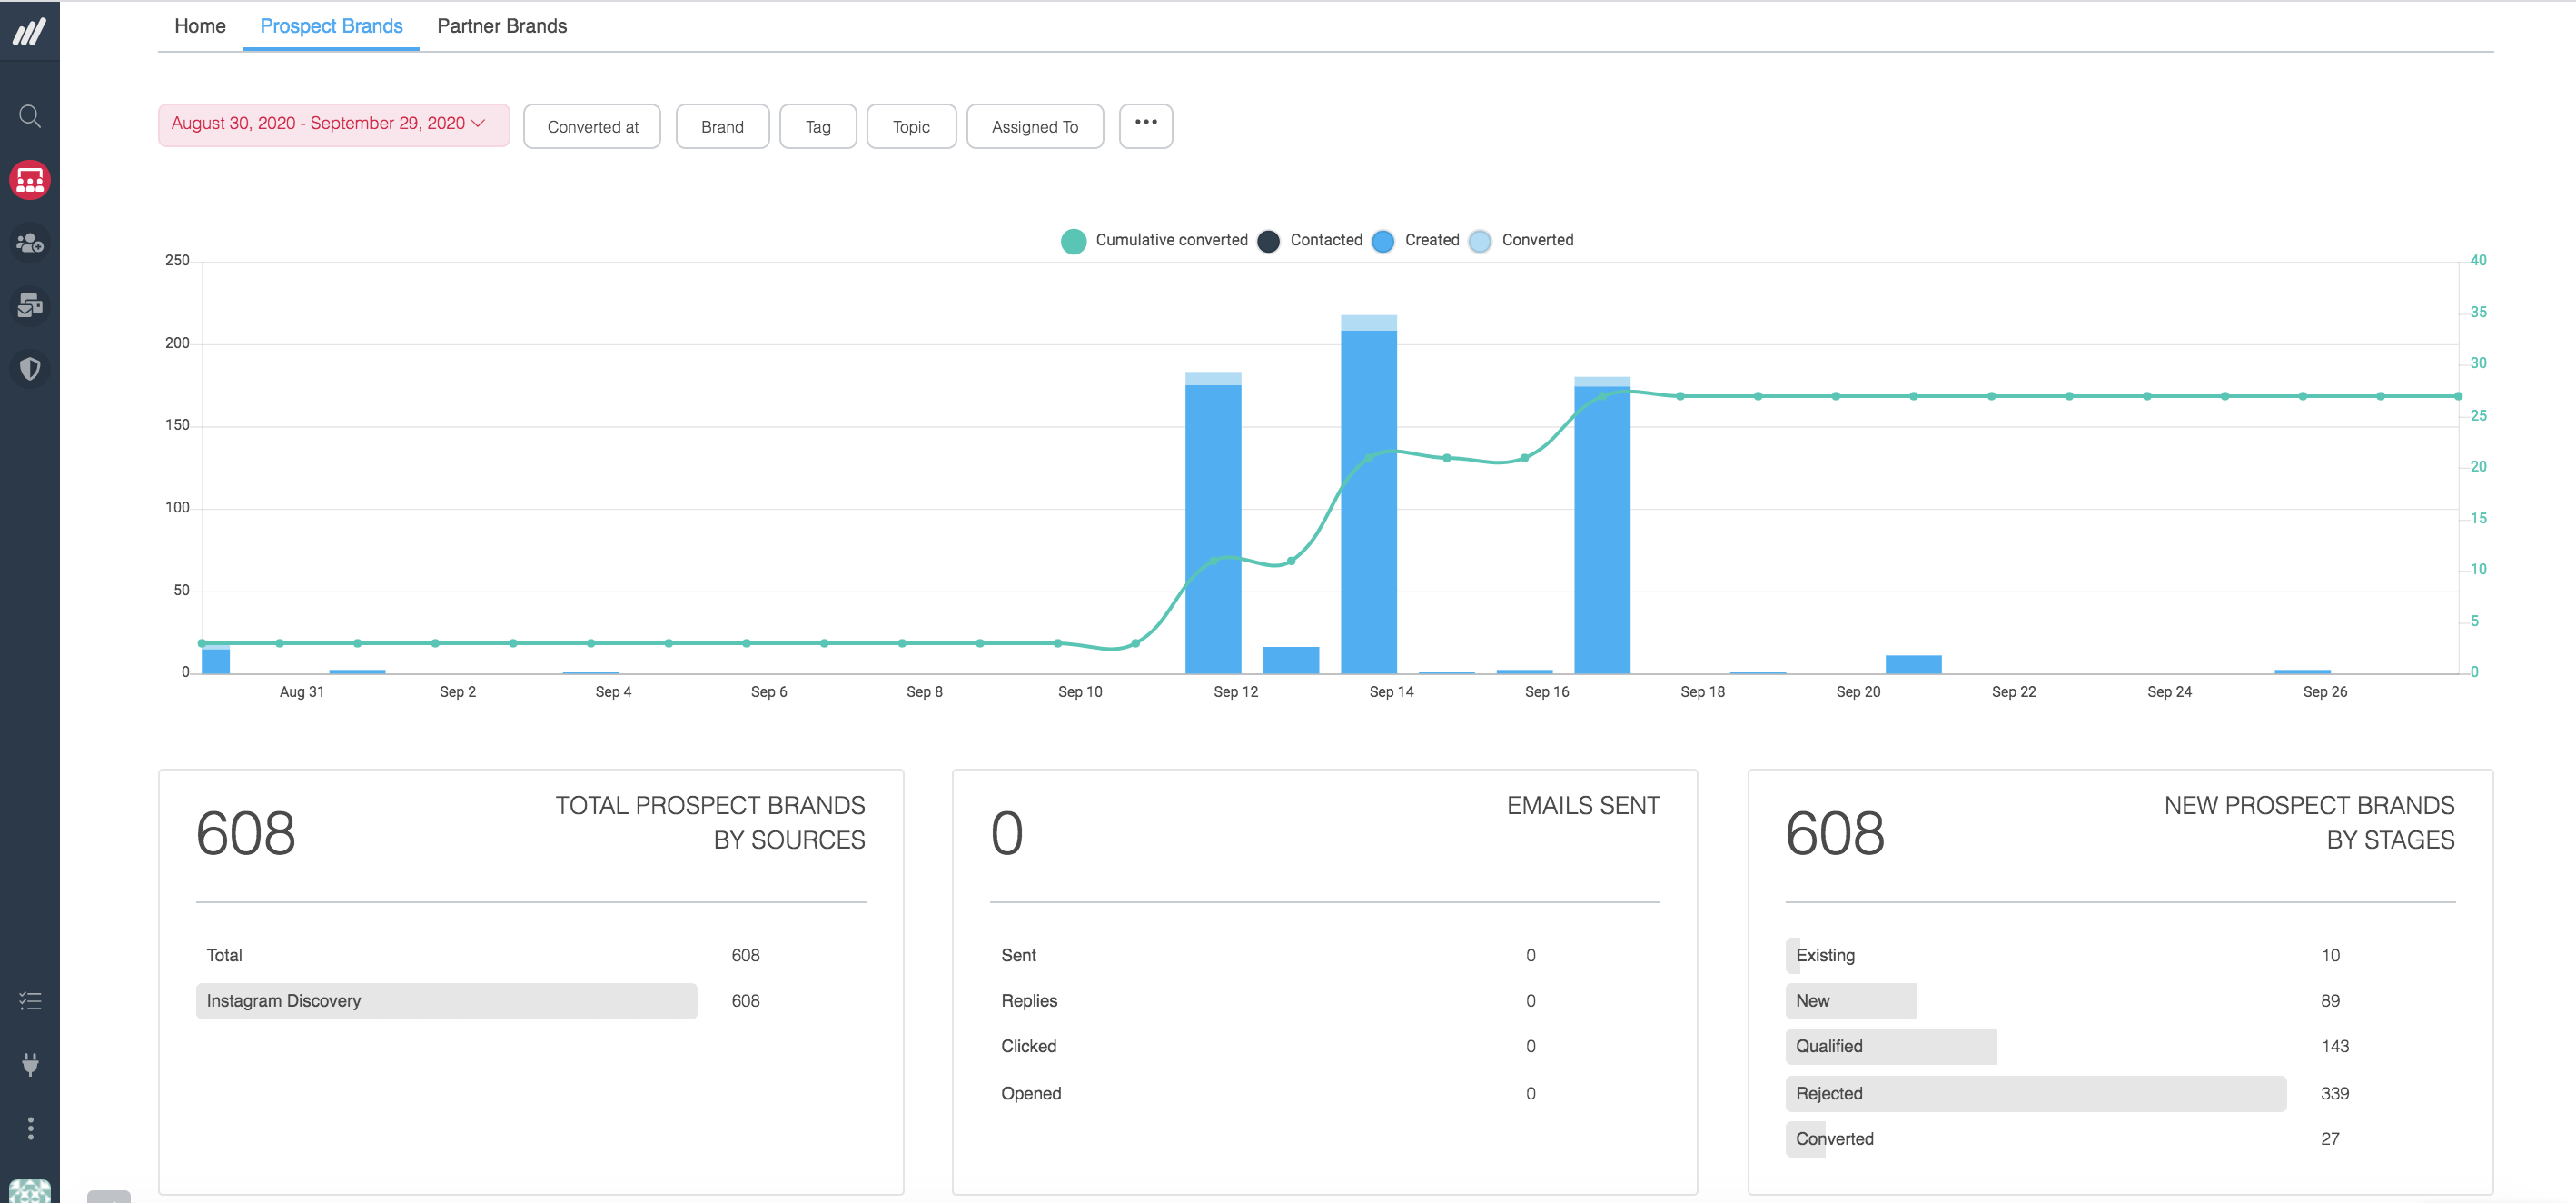
The Prospects Brands Dashboard monitors the effectiveness of your team's Prospecting and recruiting efforts. See how many prospects you’re converting at a glance.
In the Prospect Brands Dashboard, you are able to view the following (listed from left-to-right & top-to-bottom of page):
- A chart showing the number of Prospects created, contacted, and converted
- Prospect sources to see where your Prospects are coming from
- Email Activity to view emails sent, clicks, and replies over time
- The stages you added Prospects to within the given time frame
- A chart showing the number of emails sent and replies received
Partner Brands Dashboard
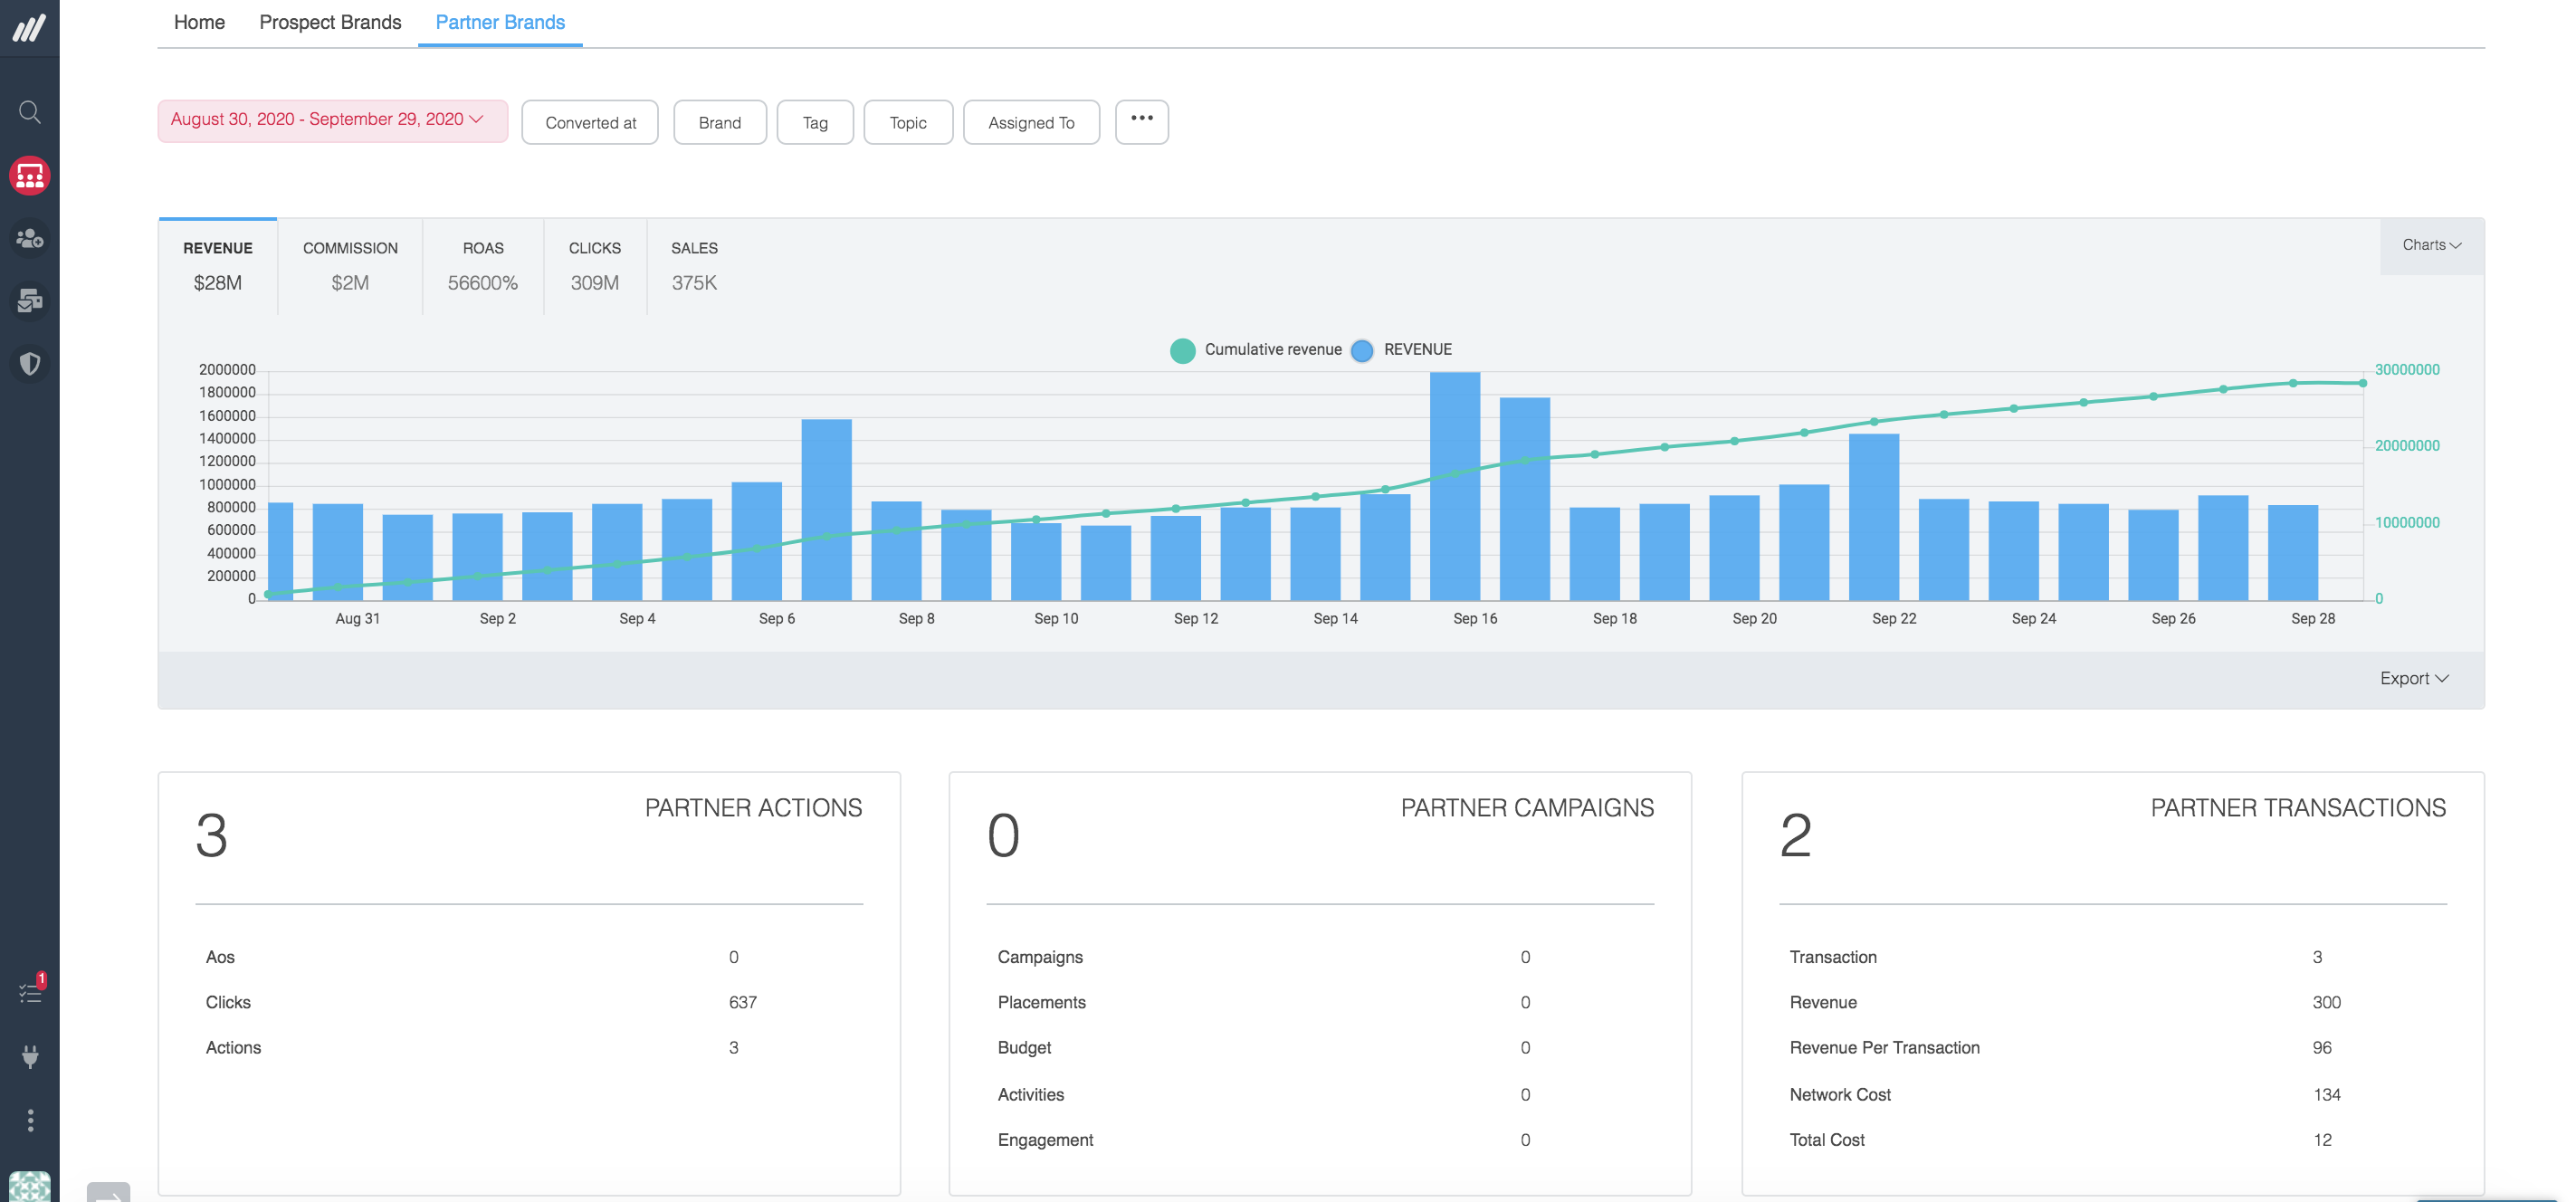
The Partner Brands Dashboard enables you to monitor the performance of your current Partners at a glance.
In the Partner Brands Dashboard, you are able to view the following (listed from left-to-right & top-to-bottom of page):
- A chart showing Partner Performance to see the revenue and actions your partners are driving
- Number of Partner Actions
- Number of Partner Campaigns (along with placements, activities and more)
- Number of Partner Transactions
- Source to see where your Partners originated from (Mediarails, Network Program, or by application)
- A table of Partner Performance by Brand to see which brands are driving results
Comments
0 comments
Please sign in to leave a comment.